Tips, Tools and Applications for the Electronic Industry in Europe

The First Intel eSPI Analysis Application for Promira Embedded Platform is released

Posted on 2015/12/07 by George

The new eSPI Analysis Application and the eSPI Active Example Files are the latest addition to the Promira Serial Platform application library – increasing the functionality of the device to include eSPI debugging at 66MHz.


Total Phase is pleased to announce the release of the eSPI Analysis Application and eSPI Active Example Files for the Promira Serial Platform. The Promira platform is the next generation of embedded tools, combining a host adapter and a protocol analyzer into a single serial platform. The introduction of protocol analysis and support for the eSPI protocol increase the capabilities of the Promira platform making it stronger, faster and smarter than any other single device on the market.

Read More

USB Type-C Connector | USB will never be the same

Posted on 2015/11/10 by George

USB Type-C is the new universal USB connector that replaces the entire plethora of medium, small, and large connectors that are used in your cell phones and your PCs with one small, easy-to-use connector. It's been adopted very rapidly because it combines ease of use with a much higher degree of flexibility.

In the 2015 EMF Survey of Embedded Developers (1,334 responses), 16.5 percent of USB developments were using the USB-C connector. Keep in mind that it’s only been available for a year. This is a huge early response to the USB-C connector.

One of the important features of USB Type-C is the alternate mode capability, which permits the use of other high-speed serial technologies the same connector. For example, you can combine USB with DisplayPort, Thunderbolt, or MHL (which is an HDMI like system). This gives the developer/system designer the ability to use one port (and one hole in the plastic) to bring out all the high-speed interconnects.

As the industry transitions to Type-C connectors, an increase in product designers' creativity will result because they can now use one port to connect with various different products. This also gives designers the ability to use standard off the shelf components for things like power supplies. This, in turn, will drive the economies of scale. It’s going to make products cheaper and more flexible consumers.

So as companies plan to incorporate and adopt USB Type-C, it’s important to be aware of how substantially this will impact the USB ecosystem. Developers will be able to connect their products to many other products. It’s becoming an even much bigger ecosystem than we had for plain USB. This means most companies will need to work with partners, both on the hardware side (the IP blocks, for example with ) and on the software side (with a system software company like MCCI) because developers will want to focus on what makes their products unique, and what gives them a competitive edge.

If a company tries to go it alone, it'll burn a team of talented engineers for some time period, dealing with the complexity of the specs and with the complexities of interoperability. If companies go with an IP provider (or a team of IP providers), that aspect is taken care of for them. Such partnerships will stand behind the engineering team, allowing them to focus on what makes these products great. CFOs should be wary of incurring internal engineering resource expenses when partnering with other experienced USB vendors can provide cost savings and reduced time to market.

Read More

Getting Started with the World's First Open source SmartScope (1 of 4)

Posted on 2015/10/19 by George

This is the first of four video tutorials that we will be publishing here about the new open source SmartScope from LabNation. The SmartScope is the only scope in the world that runs on all major platforms such as Windows, OSX, Linux, Android and iOS (jailbroken).

Read More

Monitoring Flash Drive Power Delivery with USB Power Delivery Analyzer, Sigrok and PulseView

Posted on 2015/10/06 by George

Introduction

Monitoring USB Type C Laptop and USB Type C Flash Drive is a common use case for the USB Power Delivery Analyzer. This article focuses on how to monitor USB Power Delivery system with USB Power Delivery Analyzer, Sigrok and PulseView. Although the following describes the USB Power Delivery between SanDisk USB Type C Flash Drive and Google Chromebook Pixel (2015) with USB Type C receptacles, similar steps can be used for other devices. The goal of this article is to demonstrate how to monitor USB Power Delivery with Power Delivery Analyzer and Sigrok and then to view it with PulseView on Ubuntu Linux 14.04 LTS 64-bit laptop.

Read More

Beagle USB Protocol Analyzer - Named One of 5 Most Useful Tools that every USB Developer to Capture and Analyze Data, and Fully Test and Verify USB Devices

Posted on 2015/09/01 by George

Were you among the crowd of attendees at Colin O’Flynn’s presentation “USSSSB: Talking USB from Python" at ESC Silicon Valley? Jacob Beningo, CSDP, president/consultant for EDN Network, attended O’Flynn’s presentation and agrees, the Total Phase Beagle USB Protocol Analyzer is among the Most Useful Tools for USB Developers. Here's the excerpt from Jacob’s most recent article about the tools he finds most useful for USB debugging and development:

Read More

Helpful hints for navigating and exploring data with your Saleae Logic/Protocol Analyzer

Posted on 2015/08/19 by George

In this post we show some helpful trix and shortcuts to zoom, pan, arrange and re-size your Saleae data very fast and easy. Let's start with zooming in and out:

Zooming in and Out

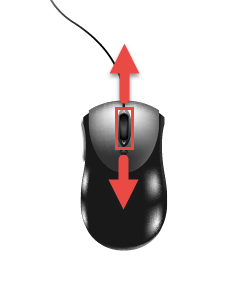
To zoom in and out, use your mouse wheel.

You can also use the up/down arrow keys, or the plus/minus keys.

Panning Left and Right
To pan right and left, click and drag the display.

You can also use the right/left arrow keys, or use the scroll bar at the bottom of the display.


Jumping between Digital Edges

Sometime digital data comes in packets, with long periods of idle in between.

To jump over idle periods, move your mouse to the far right or far left of a particular channel - a jump button will appear.

Click this button to jump to the next digital transition on that channel.

You can also use the keyboard shortcuts N and P (next and previous). The keyboard shortcut applied to the channel whose jump button was last pressed.


Scrolling Through Channels
Sometimes you may have more channels displayed than can fit on the screen at the same time.

Move your mouse over the channel labels on the left side of the software, and scroll up and down with your mouse wheel.

Read More

How to Collect Data and Device Settings with Saleae Logic/Protocol Analyzers

Posted on 2015/08/12 by George

Demo Mode
When no Logic device is connected, the software will work in a demo mode - which is virtually identical to how it will function when a device is connected. This way you can become familiar with the software before your Logic device arrives.

Read More

How to accelerate sending SPI data with the high speed Cheetah SPI Host Adapter?

Posted on 2015/07/14 by George

Questions: I am sending 5 bytes of SPI data using the Cheetah SPI Host Adapter, and Cheetah Python API. It takes about 210 ms to send this data, how do I reduce the programming time?

Read More

Analyze and Capture CAN Traffic Using the Komodo Interface

Posted on 2015/04/14 by George

Watch this short demonstration on how to use the Komodo CAN Duo Interface and the Data Center Software to monitor and analyze CAN data in real time.

Read More

Benefits of using a data logger to debug embedded systems

Posted on 2015/04/07 by George

A data logger is an electronic device that is used for data acquisition to record data over time according to specific performance parameters. Typically, the device is equipped with or works in conjunction with other instruments or sensors. Data loggers are used across many industries to record measurements such as battery level, vibration, voltage, sensors, temperature, events and more.

Having a data logger for debugging is beneficial because it increases visibility and runs continuously; the data is filtered and qualified to provide the most relevant information. The increased amount of data is key in providing a better understanding of the events that lead up to the bug.

The limitation in using a logic analyzer alone when recording samples is the device’s memory. Once the internal memory reaches capacity, the data can be analyzed. The issue is a ‘dead zone’ in which data goes unrecorded. The dead zone is the small window of time it takes for the logic analyzer to rearm its trigger. This data is lost which may result in the bug going undetected if it occurs during this timeframe.

By using a logic analyzer that has data logging capabilities, visibility is increased and the issue of the dead zone is eliminated. Unlike a typical oscilloscope or logic analyzer, Logic can record many more signals for much longer at a much faster speed. Logic’s built-in data logger enables continuous recording by compressing digital signals thus memory is only affected by changes in digital data. While data loggers usually have a slower sampling rate, Logic Pro 8 and Logic Pro 16 are equipped with a USB 3.0 input, which allows capturing of digital waveforms up to 100MHz, while sampling at 500 MSPS. A faster sampling rate also increases the applications you can use it with.

The advantages of using a logic analyzer with data logging capabilities are apparent. Logic’s data logger is extremely reliable, making testing and measurement easier than ever.

Learn more about the Logic Pro 16

Read More
The Store
Content Center
Contact us

FOLLOW US

Subscribe to Email Updates